The fleet is down on budget and nobody can say why.
Reports show the shortfall. They cannot tell you whether it came from the weather, a slow decline, or a fault someone could have fixed. The gap gets discussed every month and closed by nobody.
Renewable energy intelligence
Peryx works out what each asset in your portfolio should have produced, explains the gap, and ranks what deserves attention. Deployed today on solar.
Where each asset is producing less than it should.
Why the gap happened, with the evidence behind it.
What to fix first, ranked by what it is costing you.
Product overview
What Peryx solves
For renewable-energy operators who already have monitoring and still cannot explain the gap between what a plant should produce and what it did.
Reports show the shortfall. They cannot tell you whether it came from the weather, a slow decline, or a fault someone could have fixed. The gap gets discussed every month and closed by nobody.
A maintenance contract dispute, a warranty claim, or an availability penalty needs evidence tied to specific equipment over a specific window. Threshold alarms and portal exports are not that.
Lenders, investors, and boards ask why generation missed forecast. An answer that cannot be traced back to operating evidence does not hold up in the meeting.
What you get
The platform is AI built on engineering context. This is what it produces.
Every material shortfall, ordered by what it costs to leave it alone.
Named causes and the affected equipment, with the operating data an engineer can check.
Drift identified before it crosses the threshold that would have raised an alarm.
Different suppliers, sites, and technologies measured on the same terms.
Performance positions traceable to operating evidence, for lenders, owners, and contractual reviews.
Output lands in your work-management and reporting systems, not only in another portal.
Industries
Deployed today on solar. Wind, storage, grid, and wider infrastructure follow.
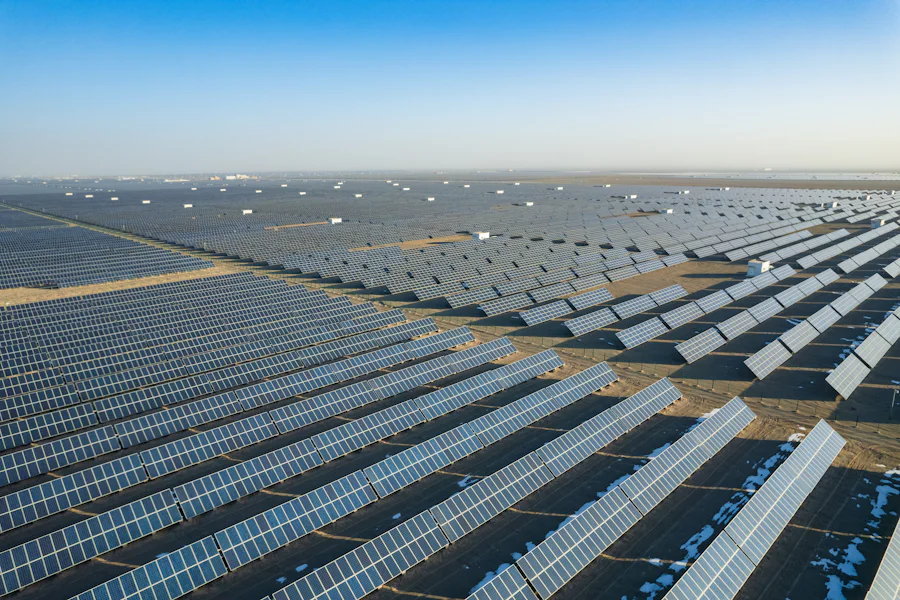
Recover lost generation across solar portfolios.
Learn more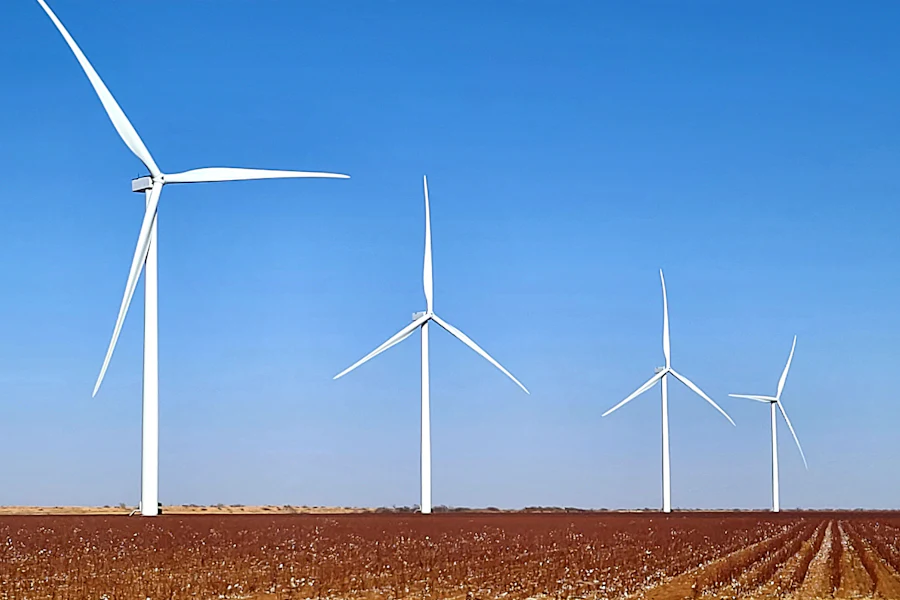
One operating picture across wind, hybrid, and storage portfolios.
Learn more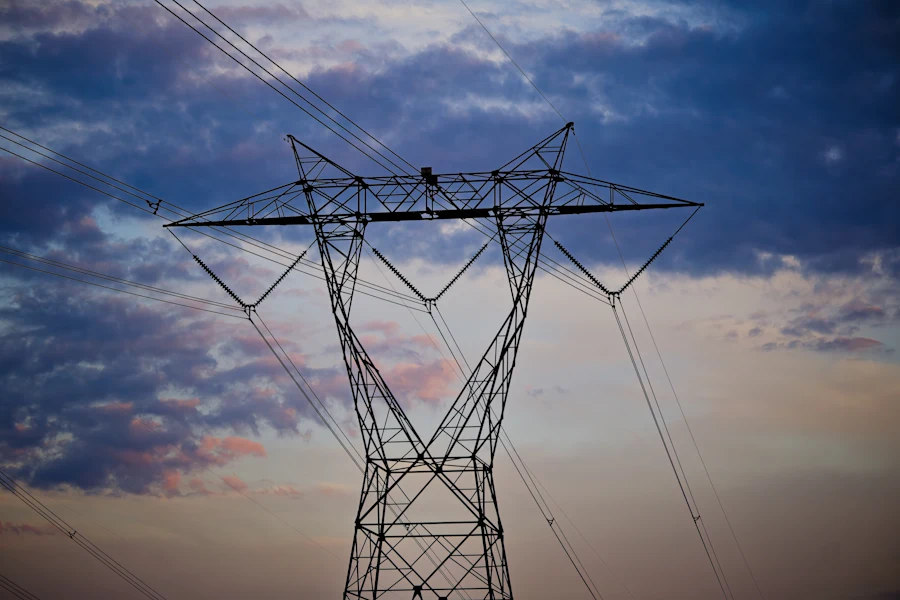
Asset health and reliability for network operators.
Learn more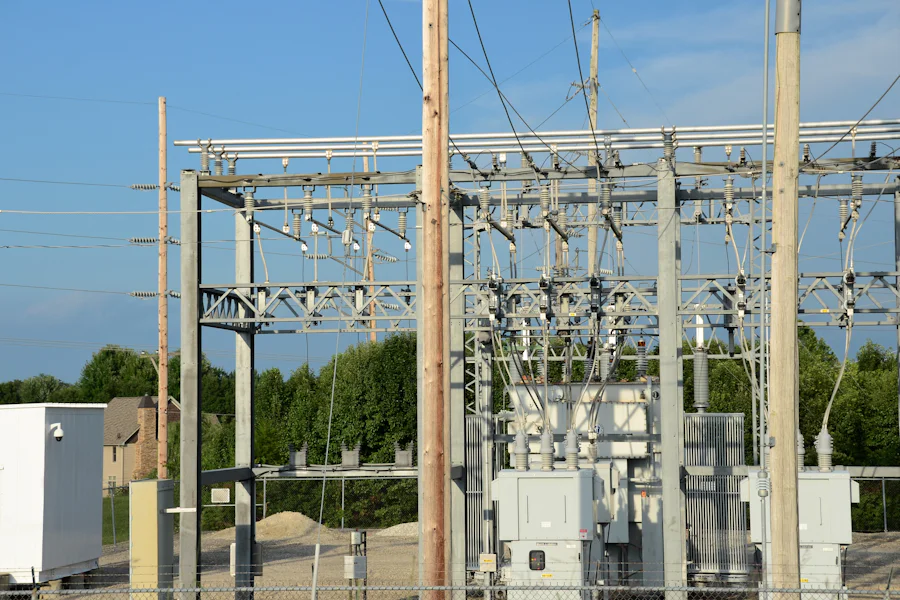
Distributed assets that report continuously and fail expensively.
Learn moreFits your stack
Peryx is a layer above your existing systems, not a replacement for them.
Getting started
A new plant goes from first connection to live findings in weeks, not months. No new equipment and no heavy lifting on your side.
Peryx connects to the systems already running at the site.
Each asset is set up with what it should be producing.
First findings are checked against site records before release.
Findings flow into the tools your team already uses.
In the product
Each finding shows how far an asset is from what it should be producing, the evidence behind it, and a suggested next step for your team.
Expected vs measured
Site performance
Finding
Localised underperformance
Output is materially below what this site should be producing.
Evaluation questions
Need a more specific answer? Ask an engineer.
We’ll show you what Peryx would find across your portfolio, and how quickly a first site can go live.